Step 2: establishing your investment risk tolerance and goals
The bottom line on top: Time is the best friend for your investment portfolio and the more time you can stay in the market, the more risk your portfolio can bear.
One reason you will always find a risk tolerance assessment as part of the portfolio construction process with any professional investment advisor, besides being a best practice, is because they have a regulatory obligation to do so. In Europe, Article 25 of MiFID II (Markets in Financial Instruments Directive) requires investment advisors to "obtain the necessary information regarding the client’s . . . knowledge and experience in the investment field relevant to the specific type of product, that person’s financial situation including his ability to bear losses, and his investment objectives including his risk tolerance."
Advisors registered in the United States are required to follow Rule 2111 of FINRA which has more specificity, "A customer’s investment profile includes, but is not limited to, the
customer’s age, other investments, financial situation and needs, tax status, investment objectives, investment experience, investment time horizon, liquidity needs, risk tolerance, and any other information the customer may disclose to the member or associated person in connection with such recommendation.".
If you have ever felt the questions you are asked to assess your risk tolerance don't seem to be particularly clear, useful or connected to reality, you are not alone. Each advisory firm designs their own risk tolerance protocol to satisfy Rule 2111 or MiFID II. There is no standard assessment and the quality of risk questionnaires vary greatly in complexity and usefulness. In general, risk tolerance questionnaires are not particularly useful or at least not applied systematically. A study conducted by Joachim Klement reports that scoring by risk-tolerance questionnaires only explains less than 15% of the risky asset variation between investors. (Klement, J. 2015 "Investor Risk Profiling: An Overview" CFA Institute Research Foundation Briefs). Clearly there are other factors at play not captured by these questionnaires that better guide investor risk-level decisions.
Typical advisor-client conversation:
Advisor: Here is the model portfolio we came up with based on your risk tolerance questionnaire.
Client: The return expectation looks kind of low.
Advisor: Well, the questionnaire you filled out scored you as a 'conservative' investor so the portfolio has minimal risk and thus a lower return.
Client: Oh, well, I want more return so I guess I'm really 'moderate'.
Advisor: No problem, we'll just change a couple answers so the result comes out 'moderate'.
Despite their limitations and misuse, risk tolerance questionnaires can still be useful when used to spark conversations between you and your advisor about your particular attitudes towards investing. But while a necessary part of the process, risk questionnaires should be taken with a grain of salt. More important will be how your investment goals are spread over time with some consideration to your behavioral biases. In other words, you need to be able to answer the following questions: "How long can you stay invested before you need to use your money?" and "How likely are you to stick to the plan?"
The single greatest factor in determining your ability to assume risk is TIME. The financial markets move up and down. The greatest risk to your wealth is to have to sell when markets are below your buying price, incurring a loss. The more time you have to wait through the inevitable down cycles, the lower the chances you will ever have to incur a loss. The central idea of a properly allocated portfolio is to minimize the probability of that happening.
The message here is, don't place too much emphasis on the output of any firm or organization's risk profile questionnaire. It is not likely to be incredibly instructive. More important is to have clearly stated investment goals, a documented investment plan, an asset allocation methodology that translates your investment time horizons into a risk budget and an awareness of the behavioral biases that you need to guard against to ensure proper execution of your plan.
Our suggestion to establish your investment risk tolerance is:
- List your investment objectives (to fund retirement, start a business, buy a second home, send kids/grandkids to college, etc.).
- List how much money you currently have allocated to each objective.
- List the time you have before you need to withdrawal funds for use on your objectives.
An example is below.
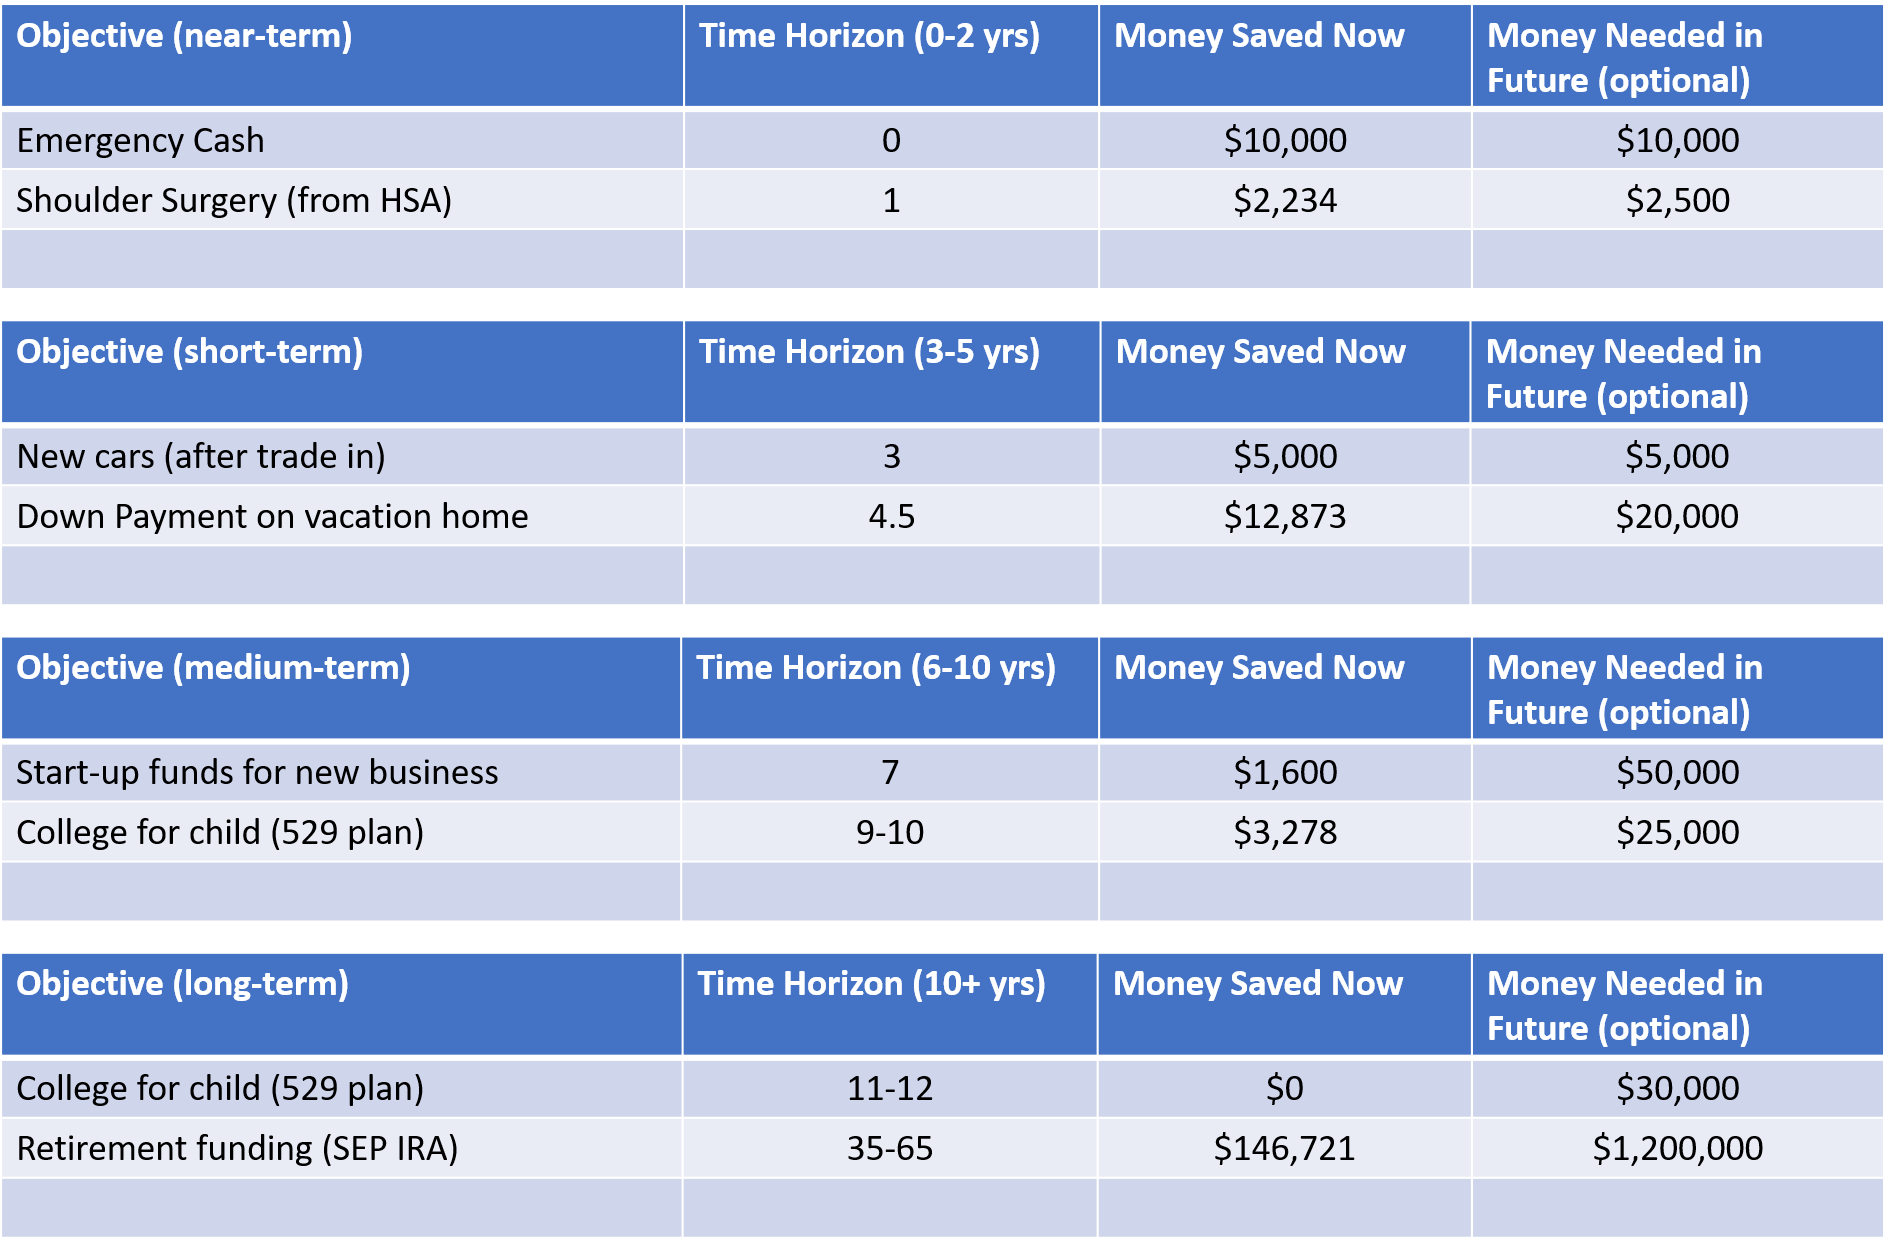
Break your objectives and investment funds into time tiers using the next example. These time tiers help establish the risk categories for your various objectives. We will help you put actual numbers on these risk tolerance categories in the section on asset allocation.
Also note, most financial advisors separate setting investment objectives and determining risk tolerance into 2 distinct and unrelated steps. But here we are effortlessly and naturally combining the two, showing how risk tolerance flows out of your investment objectives.
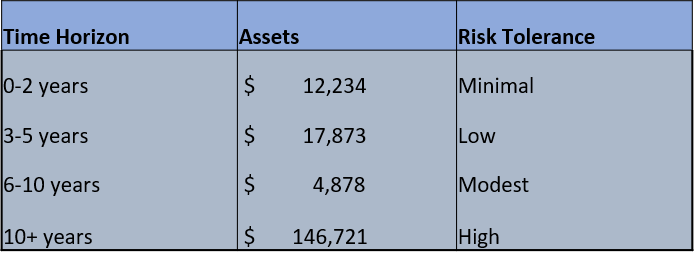
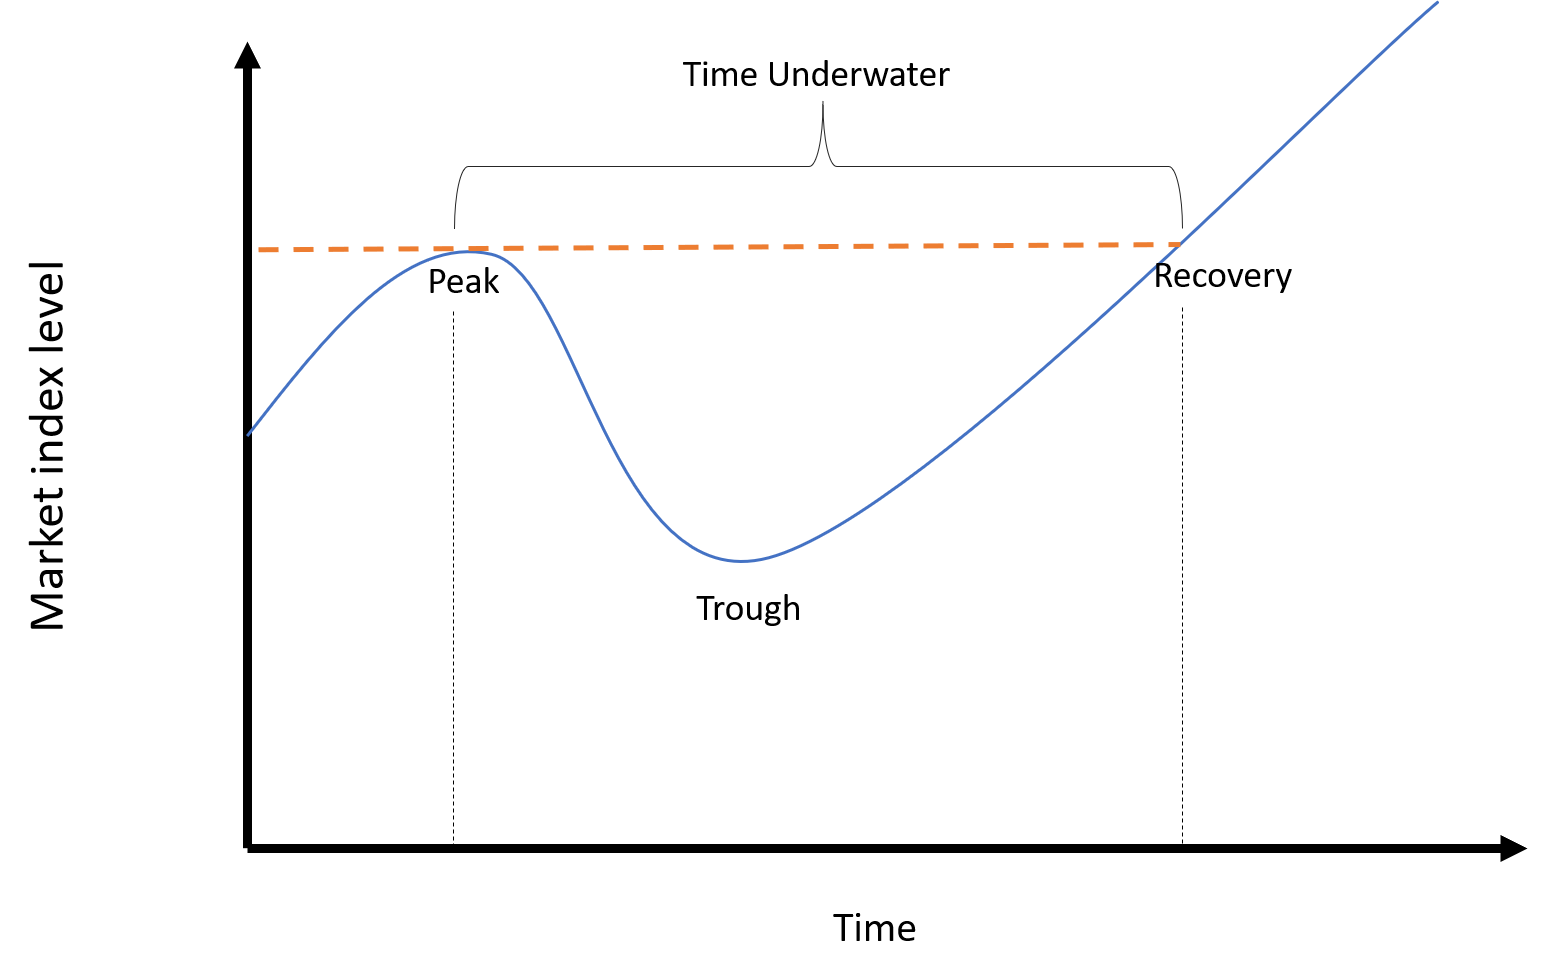
Why do we use the time periods we do? Because our research into historical market downturns shows that in modern times, the "time underwater", or the time it takes from the beginning of a significant (at least ~10%) decline in the market to the time the index level recovers is usually less than 3 years. Some corrections (declines of >10%) and bear markets (declines >20%) last between 3-8 years but there hasn't been a market loss that hasn't recovered within 10 years in modern history.
The practical application of this data is that the longer you can keep funds invested, the more of the inevitable market declines you can endure. Funds you need sooner should be invested more conservatively, Funds not needed for many years have a higher risk tolerance. Properly allocated and with the exercise of good discipline, you should never have to sell an investment assets at a loss.

Go directly to Step 3: Behavioral Assessment
deeper dive
What is "risk" anyway?
The way you think about risk in your portfolio is probably a very intuitive notion of the possibility of loss or not meeting some return objective. That's a good start. In Modern Portfolio Theory (MPT), we simply take the next step and try to put a number on that possibility. More precisely, we try to quantify the range we expect your investment returns to fall in. Because most historical asset returns are roughly follow a normal distribution (or "bell") curve, MPT uses the standard deviation as the unit of risk. That is to say, the range around an expected return that the actual return is likely to fall in. We say that a riskier asset has more volatility, meaning a wider range the actual return is likely to fall in. More volatile, or risky, assets are less predictable in their outcomes and take a wider path in their market value through time.
With most questionnaires, your risk tolerance profile is usually broken down into two domains:
1) Your willingness to take risk, which are more subjective traits such as your preferences and reaction (usually hypothetical) to various investment scenarios.
2) Your ability or capacity to take risk, which is more objective such as your age, experience, existence of other assets and your investment time horizon.
This just confuses the issue, creating two classes of factors that have no empirical basis. Risk is too often thought of subjectively but in modern portfolio theory, it has an objective quantification that can be modeled. As a result, every time-horizon has an optimal risk level which maximizes the probability of achieving a return objective. This does not change because you have other assets, how old you are or how squeamish you get when the financial media explodes in faux-panic. Shift from thinking in terms of your risk tolerance to your investment portfolio's risk tolerance, which is a function of time in the market. The only influence you have is if you are prone to behavioral biases and errors. This can be mitigated through education and a well designed Investment Policy Statement you can stick to.
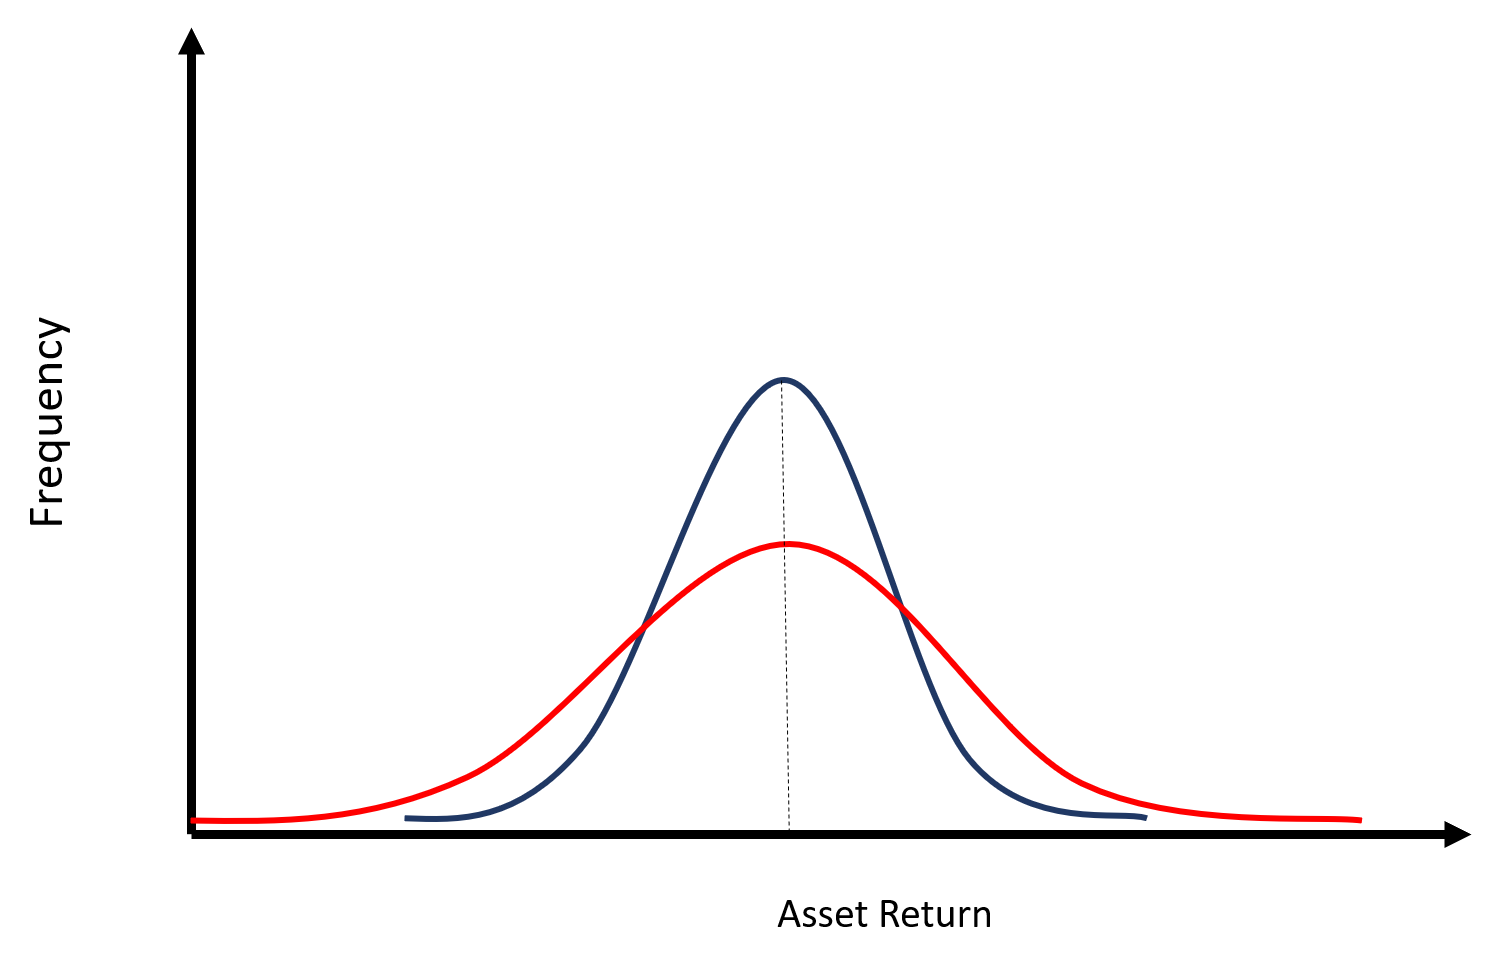
We don't need to introduce a formal discussion at this point to illustrate the point. In the graph above, both the blue asset and the red asset have the same average, or expected, return, as seen by the black dashed line. However, the return of the blue asset is the average return much more frequently than the red asset, whose peak is not as high. Instead, the red asset's return deviates from the average much more frequently. The blue asset is more reliable and we say that the red asset is a riskier asset, because the probability of a significantly lower outcome is higher than the blue's.
risk tolerance increases with time horizon
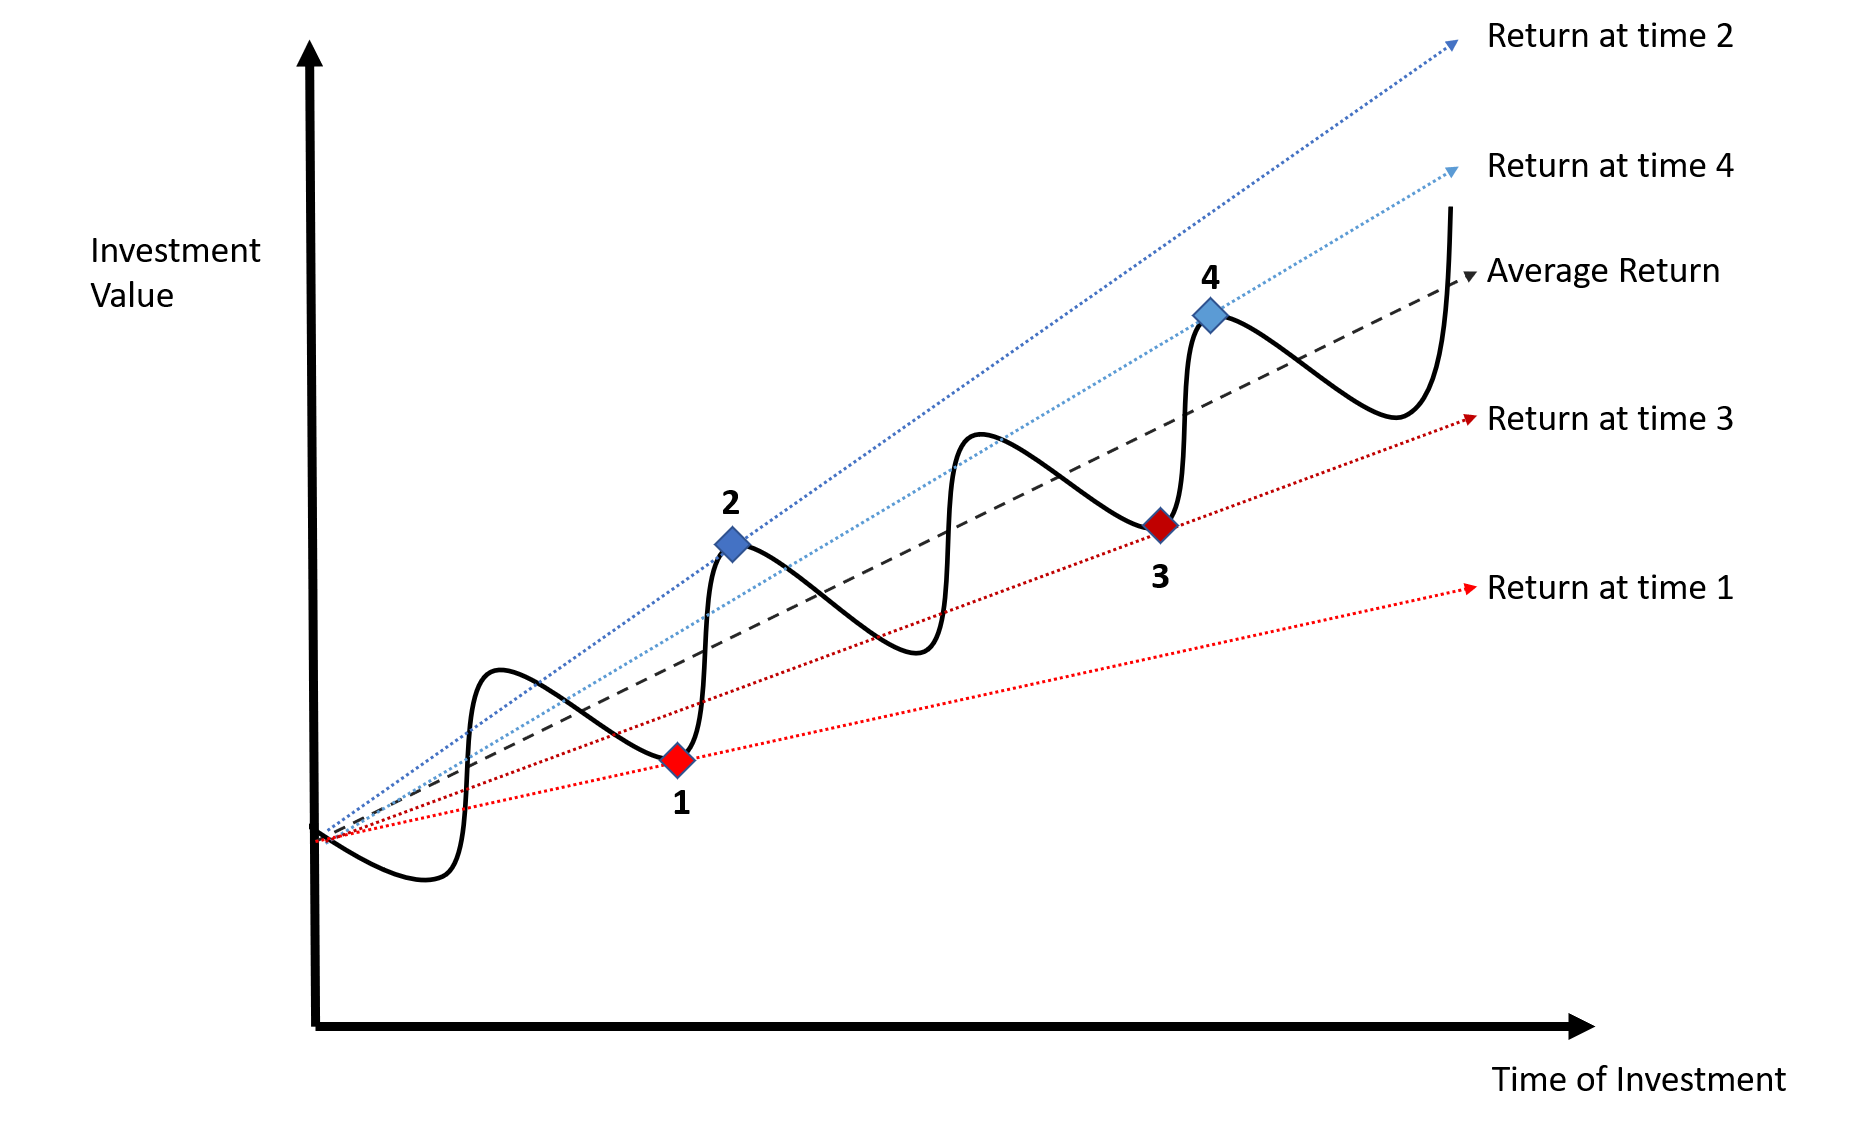
As time increases, the rate of return (slope of the return line) at any given point along the price curve (solid black curve) get closer to average. This reversion to the mean is the basis for why longer-term investments can bear increased risk.
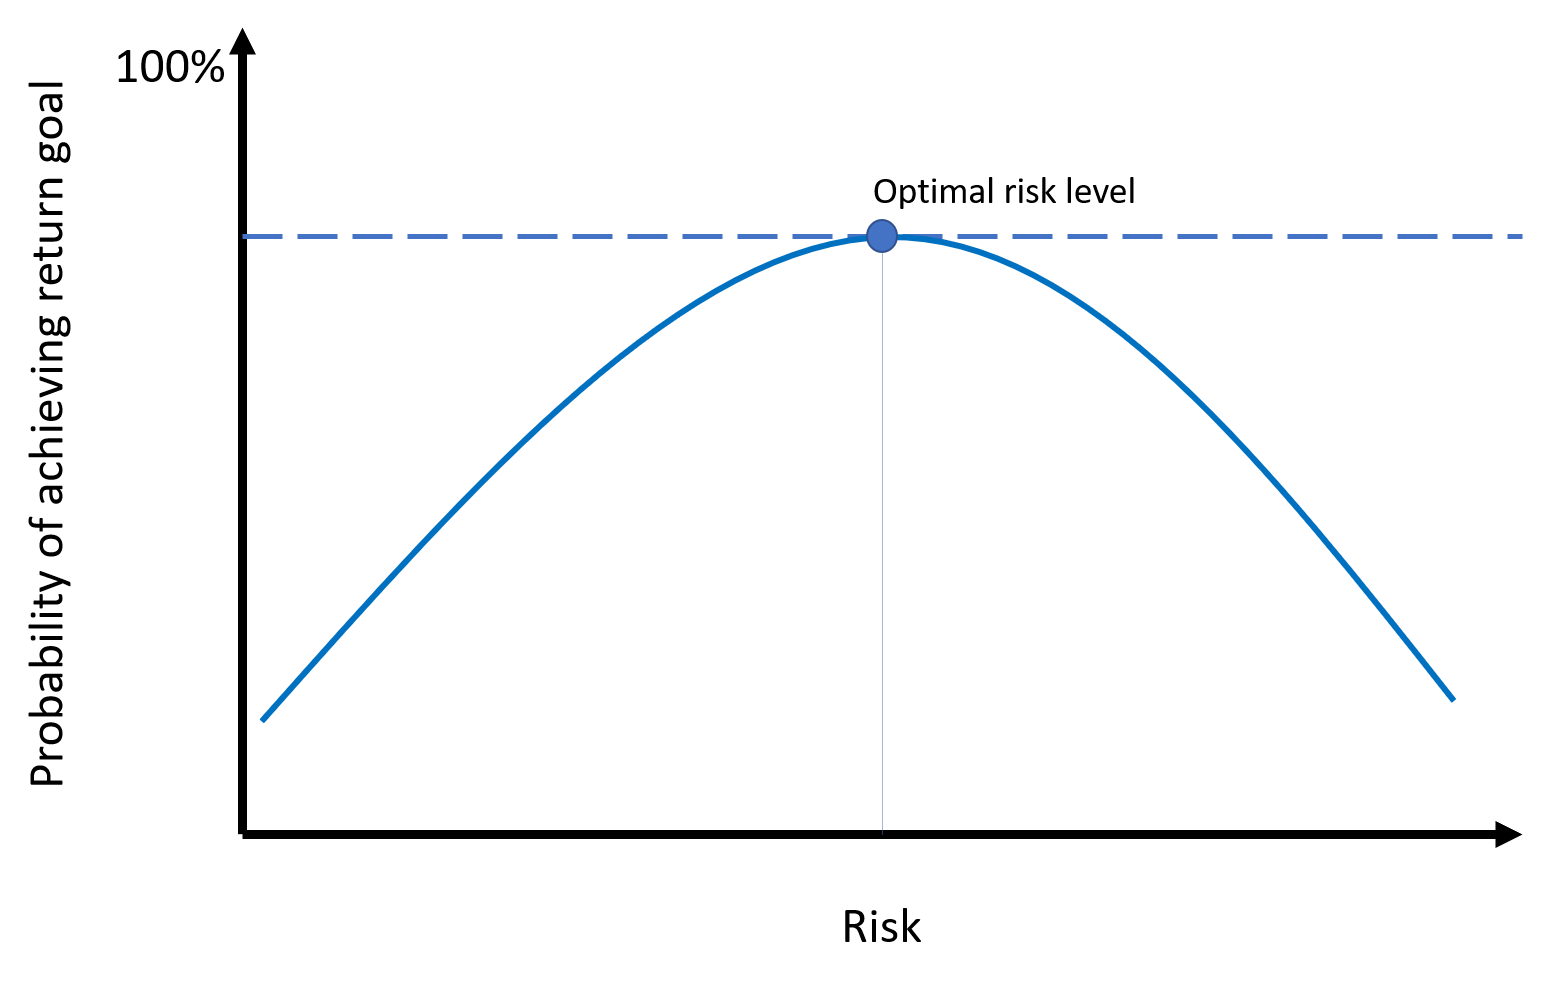
For any given asset or investment portfolio, there is an optimal level of risk or volatility. Too little risk and the expected return is likely not enough to compensate for the risk. Too much risk and the chances of falling short increases as the likelihood of recovering from a low return before the time horizon ends diminishes.
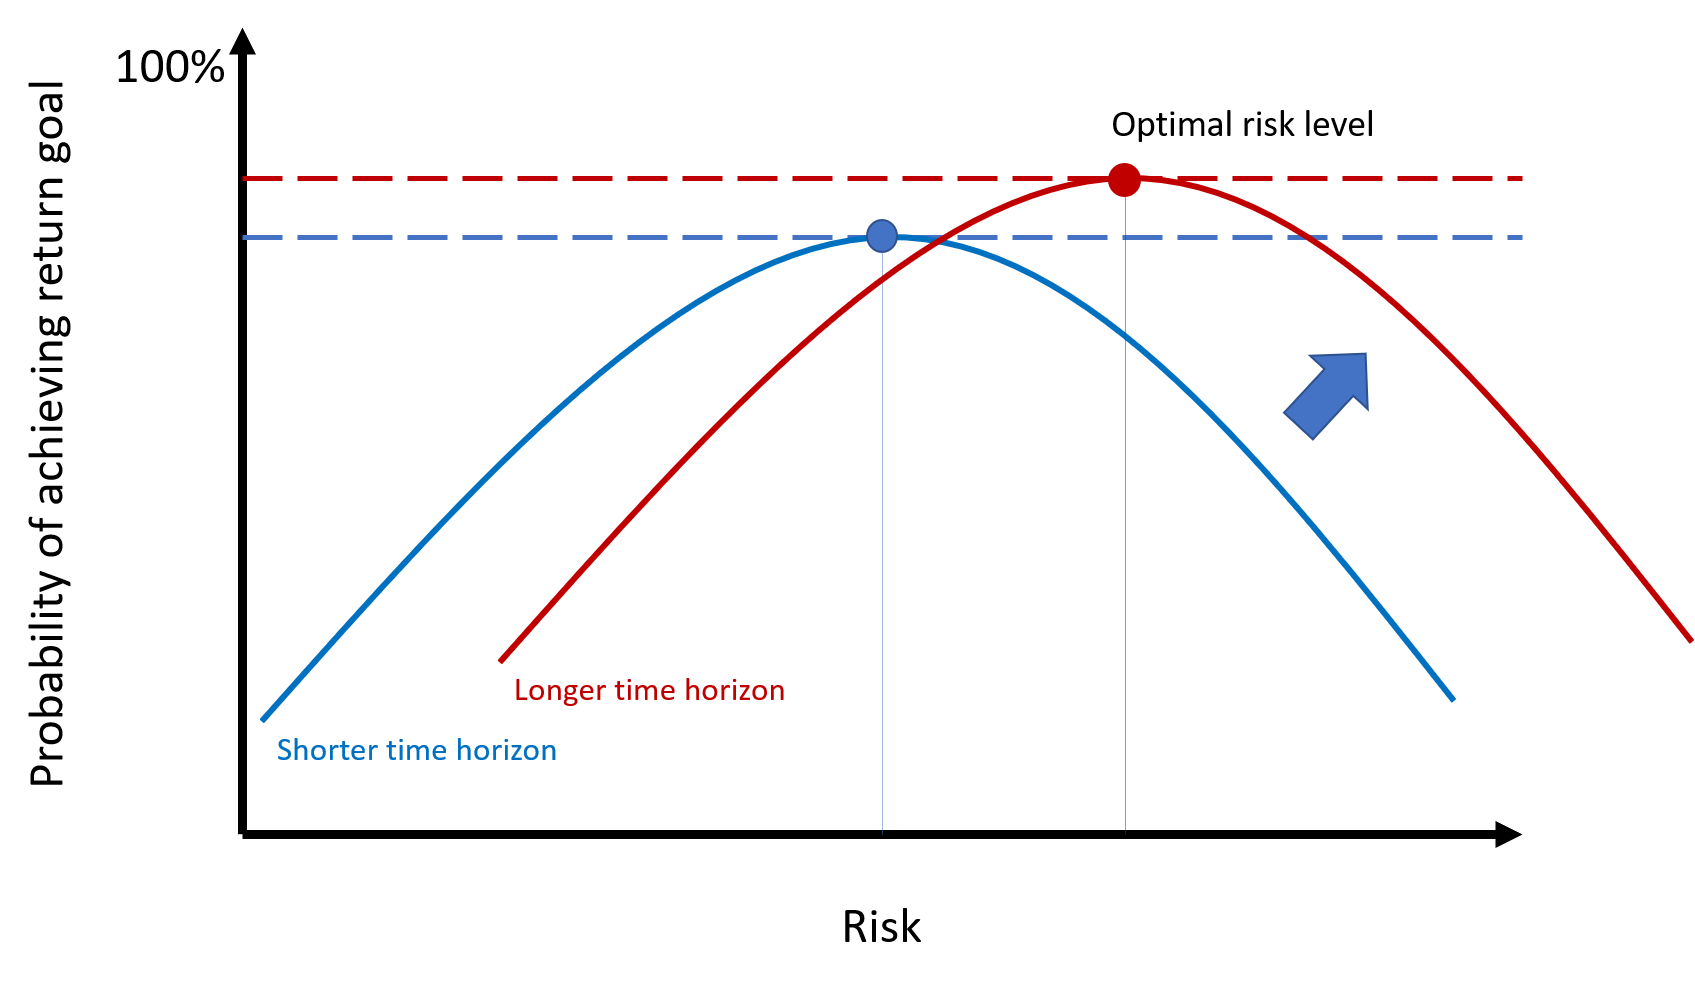
But as we saw above, with time, the return projections get closer to the average. Thus, with longer time horizons, the portfolio can bear more risk and increase the chances of meeting a return goal.

As the time horizons increase, the series of optimal risk for each time horizon defines an upward sloping curve that illustrates the higher return expectation as risk increases.